Graph Sketching
A valuable skill in physics is the ability to quickly sketch a function, to get an idea about how it behaves and any interesting features it may have. Doing this on a computer is a challenge we face, and providing automated feedback an even greater one!
Our current method of asking graph sketching questions is to either ask users to type in co-ordinates of key features or to pose a show/hide style question and simply reveal the answer. These methods have their drawbacks, with co-ordinate entry not ensuring users have attempted to draw a curve, i.e. they could simply calculate the values from the equation. Show/hide questions simply have no way of ensuring the question is attempted, and don’t allow us to provide feedback or award marks.
Our first attempt at a graph sketching tool allows users to draw functions freehand with a mouse, trackpad or even touchscreen! Once drawn, the curve can be customised by dragging any of its maxima and minima, along with stretching and translating it. We currently can’t mark the answers provided, but more on that later!
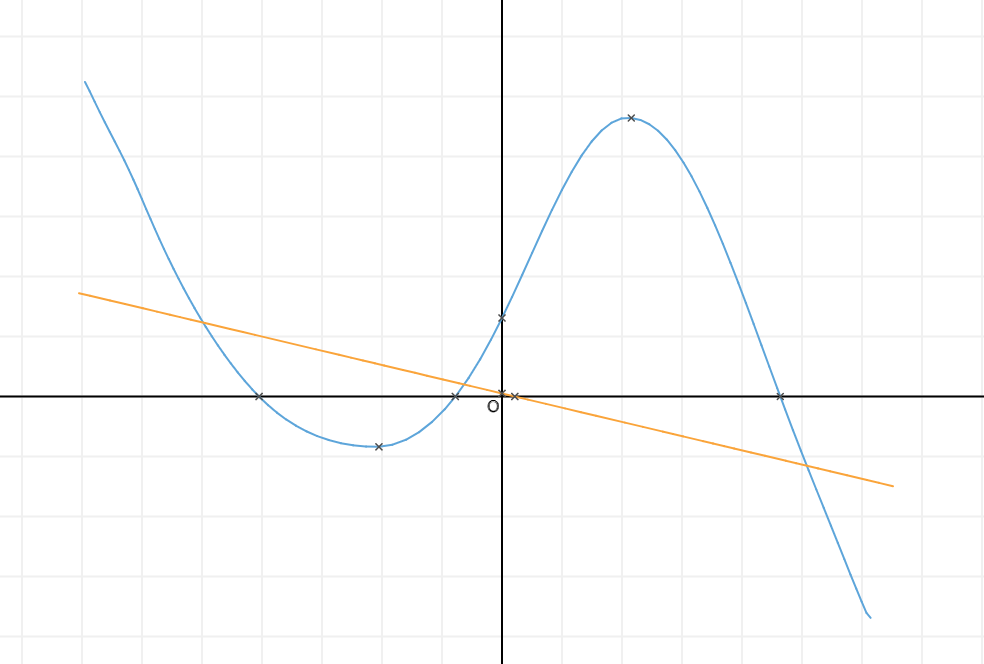
The axes aren’t measured, allowing users to focus on the shape of the curve and think more about the general scale than about going through exact points. Labels can be dragged and anchored to special points (turning/crossing points), hopefully of use for answers to certain questions.
At the moment only the ability to sketch curves exists, we’re working on implementing marking and making it fully functional. With users all entering slightly differing curves as answers to the same question (given the lack of a scale) it’s going to take a bit of time to develop a robust graph checker!
If you’d like to have a go with the current graph sketching implementation, the test page can be found here; and you can get in touch with any queries or feedback here!

Ben Hanson
Ben splits his time between the technical and content sides of Isaac, primarily a physicist working on the project's books.